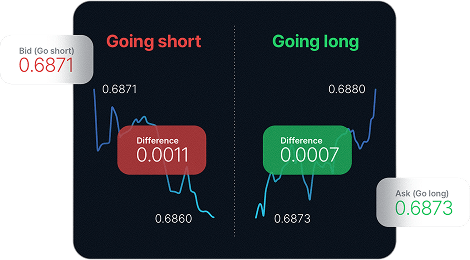
| AUDCAD |
Australian Dollar vs Canadian Dollar |
1.46 |
0 |
0.66 |
| AUDCHF |
Australian Dollar vs Swiss Franc |
1.9 |
0 |
0.8 |
| AUDJPY |
Australian Dollar vs Japanese Yen |
1.65 |
0 |
0.55 |
| AUDNZD |
Australian Dollar vs New Zealand Dollar |
1.56 |
0 |
0.76 |
| AUDSGD |
Australian Dollar vs Singapore Dollar |
2.6 |
0 |
1.1 |
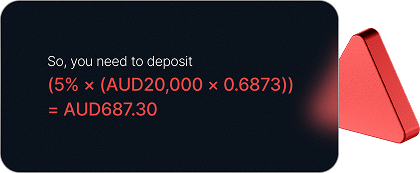
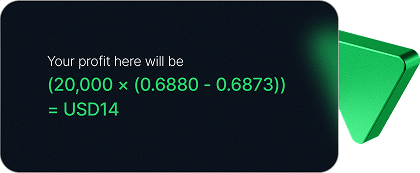
| AUDUSD |
Australian Dollar vs US Dollar |
1.43 |
0 |
0.33 |
| CADCHF |
Canadian Dollar vs Swiss Franc |
1.59 |
0 |
0.79 |
| CADJPY |
Canadian Dollar vs Japanese Yen |
1.8 |
0 |
0.69 |
| CHFJPY |
Swiss Franc vs Japanese Yen |
3.21 |
0 |
2.1 |
| CHFSGD |
Swiss Franc vs Singapore Dollar |
3.62 |
0 |
2.48 |
| EURAUD |
Euro vs Australian Dollar |
1.87 |
0 |
0.77 |
| EURCAD |
Euro vs Canadian Dollar |
2.59 |
0 |
0.99 |
| EURCHF |
Euro vs Swiss Franc |
1.6 |
0 |
0.5 |
| EURCZK |
Euro vs Czech Koruna |
66.26 |
0 |
48.86 |
| EURDKK |
Euro vs Danish Krone |
10.75 |
0 |
4.75 |
| EURGBP |
Euro vs Great Britain Pound |
1.58 |
0 |
0.48 |
| EURHUF |
Euro vs Hungarian Forint |
34.75 |
0 |
13.55 |
| EURJPY |
Euro vs Japanese Yen |
1.64 |
0 |
0.54 |
| EURMXN |
Euro vs Mexican Peso |
58.54 |
0 |
38.54 |
| EURNOK |
Euro vs Norwegian Krone |
40.6 |
0 |
33.1 |
| EURNZD |
Euro vs New Zealand Dollar |
3.21 |
0 |
2.11 |
| EURPLN |
Euro vs Polish Zloty |
13.07 |
0 |
9.77 |
| EURSEK |
Euro vs Swedish Krona |
38.59 |
0 |
33.09 |
| EURSGD |
Euro vs Singapore Dollar |
2.33 |
0 |
1.23 |
| EURUSD |
Euro vs US Dollar |
1.27 |
0 |
0.17 |
| EURZAR |
Euro vs South African Rand |
72.14 |
0 |
60.64 |
| GBPAUD |
Great Britain Pound vs Australian Dollar |
3.04 |
0 |
1.94 |
| GBPCAD |
Great Britain Pound vs Canadian Dollar |
2.85 |
0 |
1.75 |
| GBPCHF |
Great Britain Pound vs Swiss Franc |
2.76 |
0 |
1.59 |
| GBPDKK |
Great Britain Pound vs Danish Krone |
20.79 |
5.2 |
14.79 |
| GBPJPY |
Great Britain Pound vs Japanese Yen |
2.43 |
0 |
1.33 |
| GBPMXN |
Great Britain Pound vs Mexican Peso |
77.71 |
0 |
57.71 |
| GBPNZD |
Great Britain Pound vs New Zealand Dollar |
5.14 |
0 |
3.61 |
| GBPPLN |
Great Britain Pound vs Polish Zloty |
24.67 |
11.4 |
23.17 |
| GBPSEK |
Great Britain Pound vs Swedish Krona |
83.37 |
14 |
78.67 |
| GBPSGD |
Great Britain Pound vs Singapore Dollar |
3.6 |
0 |
2.37 |
| GBPUSD |
Great Britain Pound vs US Dollar |
1.66 |
0 |
0.56 |
| NZDCAD |
New Zealand Dollar vs Canadian Dollar |
1.97 |
0 |
1.15 |
| NZDCHF |
New Zealand Dollar vs Swiss Franc |
1.73 |
0 |
0.91 |
| NZDJPY |
New Zealand Dollar vs Japanese Yen |
2.11 |
0.1 |
1.01 |
| NZDSGD |
New Zealand Dollar vs Singapore Dollar |
2.6 |
0.1 |
1.5 |
| NZDUSD |
New Zealand Dollar vs US Dollar |
1.83 |
0.1 |
0.63 |
| USDBRL |
US Dollar vs Brazilian Real |
34.99 |
10 |
24.99 |
| USDCAD |
US Dollar vs Canadian Dollar |
1.79 |
0.1 |
0.69 |
| USDCHF |
US Dollar vs Swiss Franc |
2.13 |
0.1 |
1.03 |
| USDCNH |
US Dollar vs Chinese Yuan |
1.79 |
0.1 |
0.69 |
| USDCZK |
US Dollar vs Czech Koruna |
54.43 |
0.1 |
37.03 |
| USDDKK |
US Dollar vs Danish Krone |
14.18 |
0.1 |
8.18 |
| USDHUF |
US Dollar vs Hungarian Forint |
224.63 |
0.1 |
11.03 |
| USDINR |
US Dollar vs Indian Rupee |
21.85 |
10 |
11.85 |
| USDJPY |
US Dollar vs Japanese Yen |
1.43 |
0.1 |
0.34 |
| USDKRW |
US Dollar vs Korean Won |
61.92 |
9.1 |
41.92 |
| USDMXN |
US Dollar vs Mexican Peso |
34.38 |
4 |
28.38 |
| USDNOK |
US Dollar vs Norwegian Krone |
41.67 |
0.1 |
33.17 |
| USDPLN |
US Dollar vs Polish Zloty |
14.17 |
0.1 |
10.48 |
| USDSEK |
US Dollar vs Swedish Krona |
41.04 |
0.1 |
32.34 |
| USDSGD |
US Dollar vs Singapore Dollar |
1.89 |
0.1 |
1.09 |
| USDTHB |
US Dollar vs Thai Baht |
168.95 |
0.1 |
148.96 |
| USDZAR |
US Dollar vs South African Rand |
47.63 |
2 |
36.73 |